
Receive a straightforward solar feasibility report for your building or portfolio, showing cost estimates, financial savings, and finance options. No jargon, just clear insights to help you decide if solar is the right step for your business.


Your Solar Annual Wrap includes an estimate of how much CO₂ emissions your system has helped avoid.
This is based on a simple principle: every kilowatt-hour generated by your solar panels is electricity that does not need to be produced by the national grid, which includes the burning of fossil fuels.
To calculate this, we follow these steps:
We convert this into tonnes of CO₂ to match standard reporting formats.
Data source: Official UK Grid emissions factors

To make the environmental impact more relatable, your Solar Annual Wrap includes a fun comparison: how many cups of tea your solar energy could have brewed over the year.
This is based on the typical amount of electricity needed to boil water in a standard kettle.
Here’s how we calculate it:
This gives a more physics-based, accurate estimate while keeping the comparison fun, simple and relatable for clients.
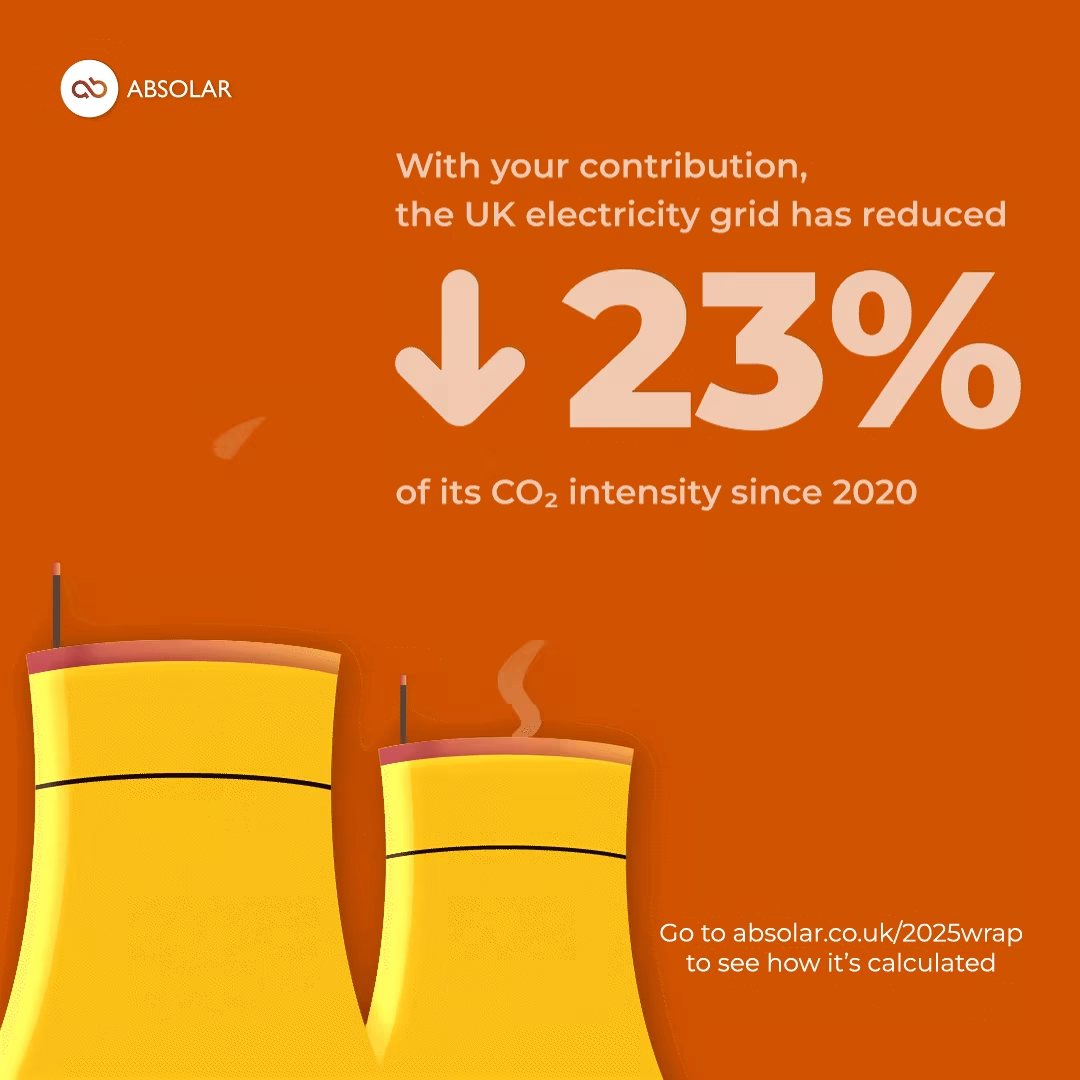
When calculating your CO₂ emissions reduction, we reference the official UK grid carbon intensity published in government statistics.
This value represents how much carbon is emitted, on average, for every kilowatt-hour (kWh) of electricity supplied by the national grid.
The UK grid has become continuously cleaner in recent years.
This is a reduction of around 23% in carbon intensity.
The change reflects the ongoing decarbonisation of the national electricity system due to increased renewable generation, improved grid efficiency and reduced reliance on coal and gas.
Data source: Official UK Grid emissions factors
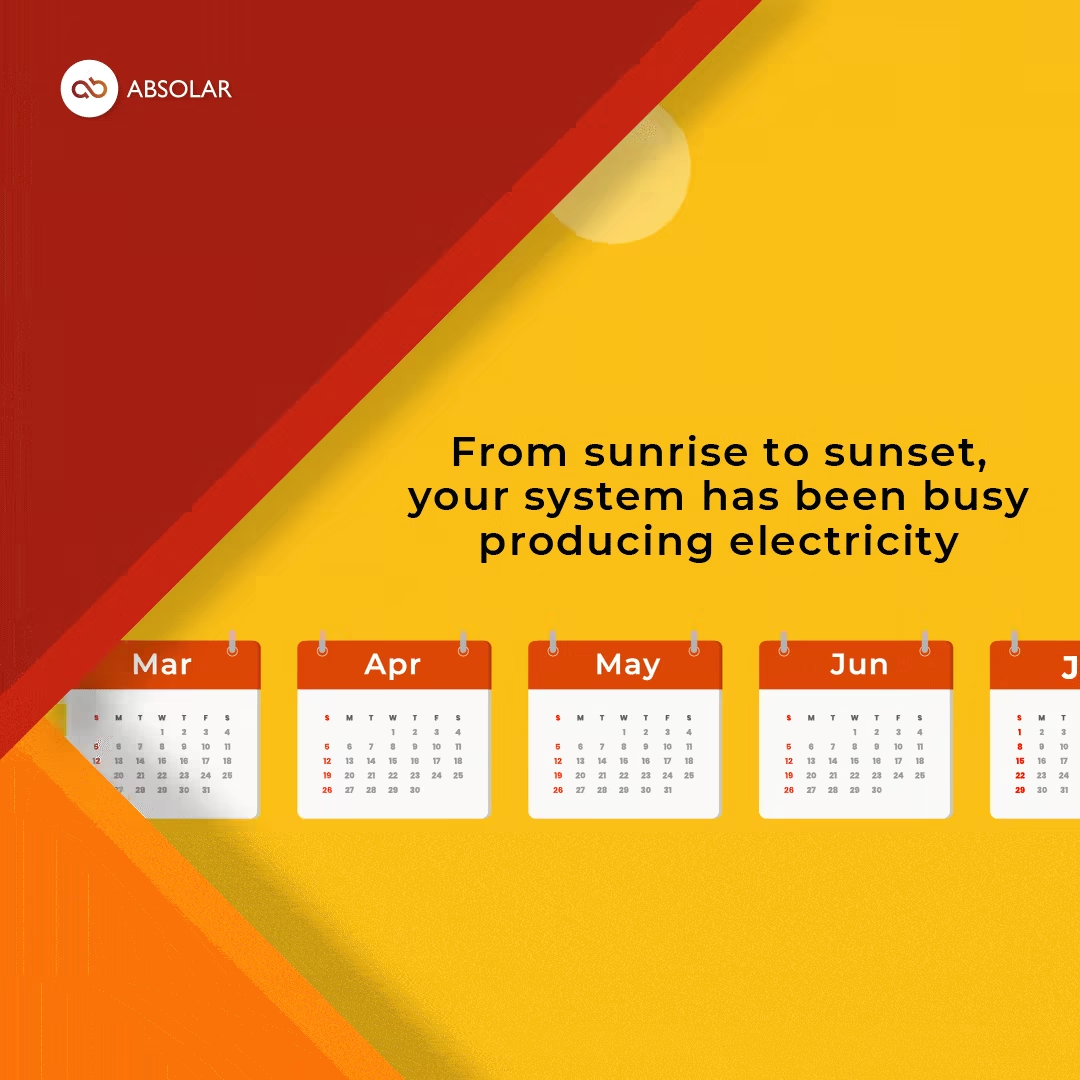
This helps you see when conditions were most favourable for solar generation and gives you a quick sense of your system’s peak output.
Here’s how we calculate it:
© 2026 Absolar Solutions Limited